Definition of Cladogram
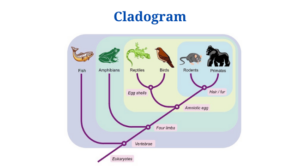
The graphical representation of the potential relationship (phylogenetic relationship) between distinct groups of species is called a cladogram. It is used to discover the evolutionary link between organisms through phylogenetic analysis.
The cladogram is made up of the Greek words clados and gramma, which represent “branch” and “characters,” respectively. Only the topography of the diagram matters in this unscaled representation of a phylogenetic analysis. It, however, lacks a time axis and instead is a basic graphic that summarizes a pattern of traits shared by various creatures. A cladogram is the beginning point for additional study, even when it involves fictitious ancestors to determine a link.
A cladogram’s characteristics
- The cladistic technique yields trees that are relative expressions of kinship rather than ancestors or descendants. It is hypothesized, for example, that Birds and Mammals are linked, but not that Mammals developed from Birds or that Birds evolved from Birds.
- Branch lengths in a cladogram are not proportional to the number of evolutionary changes, hence they have no phylogenetic significance.
- A cladogram’s external taxa neatly line up in a row or column.
- Cladograms are created by analyzing organism physical characteristics as well as DNA or RNA sequencing data.
- However, computational phylogenetics has recently been applied in the construction of cladograms by combining existing features.
- Cladograms are the foundations of phylogenetic tree construction.
- Despite their various designs, cladograms are all made up of lines that branch off of other lines to indicate the putative ancestors of various organisms.
Parts of a Cladogram
A cladogram is a diagram consisting of the following parts:
Root
- The early common ancestors of all the organisms in a cladogram are called roots.
- Any cladogram’s beginning point is called a root. The root, on the other hand, could indicate that it is from one of the bigger clades.
Image Source: BioNinja.
Nodes
- Each node represents a possible ancestor with two or more offspring taxa.
- In all cladograms, nodes represent the bifurcating branch point of divergence.
- As a result, each location where a group of organisms divides or separates into different groups has a node.
Clades
- Clades are groups of organisms or genes that include all of its members’ most recent common ancestor as well as all of that ancestor’s descendants.
- An ancestor and all of his descendants make up a clade.
- It entails a specific node as well as all of its linked branches.
Outgroup / Taxon
- The most distantly related group of animals that isn’t always a clade is called a taxon or an outgroup.
- For the rest of the cladogram, this serves as a point of reference or comparison.
Branches
- A branch in a cladogram is a line that connects all of the cladogram’s other elements.
- In some circumstances, the branch length signifies the degree of divergence or the degree of connection between various species.
Cladogram Construction
Cladograms can be created based on physical traits or molecular data such as DNA, RNA, or protein sequencing, as previously mentioned.
As a result, based on the characters used in the cladograms, they can be created in two ways:
A. Using morphological/structural characteristics as a starting point
Step 1: Choose the characters that will be utilized.
- In phylogenetic analysis, the initial step is to establish whether a character is derived or primitive (innate).
- Characters that are unaffected by environmental variables should be chosen in this scenario.
- The outgroup comparison approach is the most used method for creating cladograms and other trees.
- When a character of an organism is chosen where the organism is not a member of the group of animals to be classified, but the selected character is the same as some of the organisms in the group, the character can be utilized as a defined character in the outgroup technique.
- The outside organism is referred to as the outgroup, whereas the organisms being classed are referred to as the ingroup.
- Other characters are now chosen within the group to further differentiate the organisms in the ingroup.
Click Here for Complete Biology Notes
[ninja_tables id=”3870″]- The outgroup is the organism with the fewest shared characteristics. Shark is the outgroup in the table above.
Step 2: Sort the organisms into groups based on their shared traits.
- Prior to generating a cladogram, a Venn diagram might be created to group the creatures.
- Start on the outside of the Venn diagram with the character that is shared by all groups.
- Make a cladogram out of the Venn diagram.
B. Making use of molecular markers
Step 1: Choose the molecular evidence that is shared by all of the creatures.
- The first step in using molecular data to build a phylogenetic tree is to decide whether to employ DNA or protein sequences.
- In most circumstances, protein sequences are preferred.
- DNA, on the other hand, is the preferred marker for understanding recent evolution.
- Hemoglobin and cytochrome c are two proteins that are found in many different organisms.
Step 2: Gather and compare molecular sequences (DNA or amino acids) for each of the creatures you’ve chosen using multiple sequence alignment.
- Clustal Omega, a multiple sequence alignment software, can be used to align numerous DNA or amino acid sequences to find similarities and differences.
- In comparison to distantly related organisms, closely related organisms will have a higher degree of sequence similarity.
Step 3: Using the data from the multiple sequence alignment, create a cladogram.
- The next step is to choose a good substitution model that incorporates the results of multiple sequence alignment to produce estimates of the relationship between the organisms.
- The Jukes-Cantor and Kimura models are two of the most widely utilized nucleotide substitution models.
- The PAM and JTT models are the most often utilized amino acid substitution models.
How do you interpret a cladogram? (How to read cladograms)
- A cladogram does not provide a detailed explanation of the relationship between different organisms, but it does provide a fundamental graphic for building one.
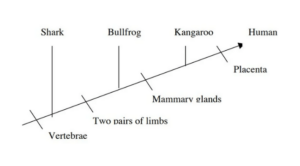
- Consider the following cladogram as an example of how to understand a cladogram.
- Four phylogenetic characters are investigated in the cladogram above.
- Humans and kangaroos are therefore more closely connected than humans and bullfrogs.
- Because it is an unscaled diagram, this cladogram cannot establish the extent of the link.
- The order of the animals does not crucial, nor does the orientation of the lines. Similarly, when we move further to the right on the cladogram, the organisms become less connected to one another.
- Bulldogs and humans are more distant cousins than sharks and humans.
- The forebears of the species are speculative and hence are not specified, as is the case with all cladograms.
- The shark is the outgroup in the diagram above, while humans and kangaroos constitute a clade.
Cladograms in various styles
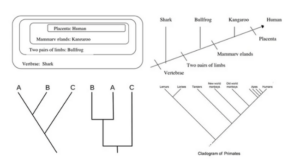
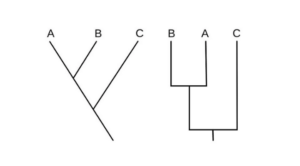
- Cladograms come in a variety of styles, depending on the shapes and orientations of the branches.
- The shape, length, and orientation of the branches are irrelevant in a cladogram because it is an unscaled representation of phylogenetic analysis.
- The following are some examples of cladogram drawing styles:
- Two phylogenetic features are investigated in both diagrams and show the same relationship between the three organisms.
Cladogram examples
- Cladograms are a type of diagram that can be used to distinguish between species based on some similar characteristics.
- The following are some cladogram examples that can be used to sort creatures into distinct groups based on their morphological characteristics:
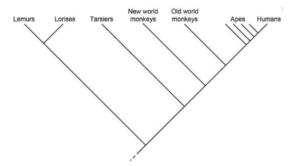
Primates’ cladogram
Image Source: Biology Dictionary.
- Primates can be classified into several taxa depending on a variety of characteristics.
- The branch leading to lemurs and lorises is regarded the outgroup in the cladogram above, whereas the remainder are in the ingroup.
- Lemurs and Lorises belong to a distinct clade that shares a node.
- The cladogram’s interior nodes represent potential ancestors between distinct groups.
- Similarly, the closer two groups are to one another, the more closely they are related.
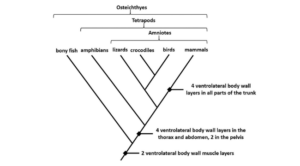
Vertebrates’ cladogram
Image Source: Biology Dictionary.
- Vertebrates can also be classified into several categories based on their traits.
- The above cladogram depicts the differentiation of vertebrates based on the ventrolateral muscle layers among the features.
- All of the groups in the cladogram have at least two muscle layers in common.
- The presence of four layers on the ventrolateral body wall helps to distinguish the taxa as we get closer to the top.
- The bony fish are in the outgroup, while the remaining species are in the ingroup.
- Crocodiles and birds, for example, belong to the same group as their common ancestor.
- The closer the species in the cladogram are, the more closely related they are based on their morphological traits, like in all previous cladograms.
Phylogenetic tree vs. Cladogram (Phylogram)
- The phylogenetic tree and the cladogram are both diagrammatic representations of phylogenetic study.
- Both of these establish a link between species of different groupings.
- Both the cladogram and the phylogenetic tree employ the same characteristics and follow the same building technique.
- The cladogram, on the other hand, is frequently regarded as the first stage in the development of a phylogenetic tree.
What are the distinctions between a cladogram and a phylogenetic tree? (phylogram)
[ninja_tables id=”3868″]
What is PhD : Meaning, How to Do, Benefits, Full Details
Citations
- https://wikiali.files.wordpress.com/2014/03/phylogentics.pdf
- http://www.bu.edu/gk12/eric/cladogram.pdf
- https://www.youtube.com/watch?v=OZo_fN0S9QQ
- https://www.instructables.com/id/How-to-Make-a-Cladogram/
- https://www.expasy.org/genomics/sequence_alignment
- https://www.answers.com/Q/What_do_the_location_of_derived_characters_on_a_cladogram_show
- https://wikidiff.com/phenogram/cladogram
- https://study.com/academy/lesson/cladograms-and-phylogenic-trees-evolution-classifiations.html
- https://quizlet.com/78553585/evolution-flash-cards/
- https://quizlet.com/5495071/chapter-17-birds-and-mammals-flash-cards/
Related Posts
- Phylum Porifera: Classification, Characteristics, Examples
- Dissecting Microscope (Stereo Microscope) Definition, Principle, Uses, Parts
- Epithelial Tissue Vs Connective Tissue: Definition, 16+ Differences, Examples
- 29+ Differences Between Arteries and Veins
- 31+ Differences Between DNA and RNA (DNA vs RNA)
- Eukaryotic Cells: Definition, Parts, Structure, Examples
- Centrifugal Force: Definition, Principle, Formula, Examples
- Asexual Vs Sexual Reproduction: Overview, 18+ Differences, Examples
- Glandular Epithelium: Location, Structure, Functions, Examples
- 25+ Differences between Invertebrates and Vertebrates
- Lineweaver–Burk Plot
- Cilia and Flagella: Definition, Structure, Functions and Diagram
- P-value: Definition, Formula, Table and Calculation
- Nucleosome Model of Chromosome
- Northern Blot: Overview, Principle, Procedure and Results

